How to calculate the occupancy rate in Excel?

Excel has always been a favorite tool amongst hotel managers.
One of the things it can be used for is to calculate the occupancy rate for your hotel. For a brief introduction on the topic of occupancy rates and what occupancy rate is considered good, see the blog post What is a good occupancy rate for a hotel.
In this post, I’ll demonstrate an effective way to calculate your occupancy rate automatically using the Excel built-in formulas.
The process is fairly simple.
Let’s start with the Excel basics..
I’m going to share two basic must-know formulas.
No matter what kind of revenue management work I’m doing in Excel, I find myself using these two formulas (almost) every time:
SUMAVERAGE
Let’s start with the SUM function.
The SUM function
This is super simple; it’s used to sum all the values within the specified cells.
Syntax: =SUM(Cell1, Cell2, Cell3, ..)
The AVERAGE function
Syntax: =AVERAGE(Cell1, Cell2, Cell3, ..)
The AVERAGE function returns the average of the values in the specified cells.
That’s all we need to work out our occupancy rate.
Step 1: Define the total number of available rooms
Here, you’ll need to start a new Excel document.
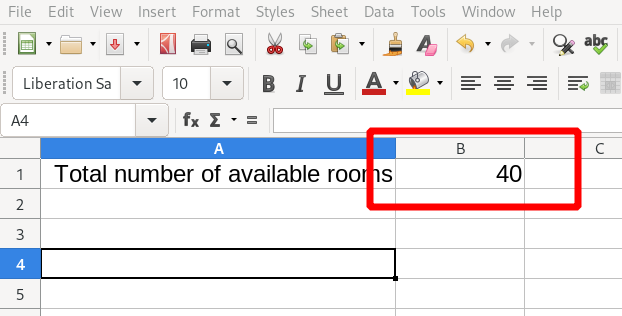
Start by defining the total number of available rooms.
Make sure you only take into account the rooms which are available to be booked. Exclude the ones which have been taken off the reservation systems, such as rooms under maintenance.
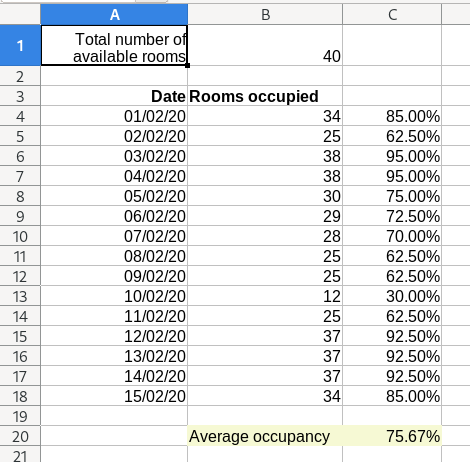
In our example we’ll put the Total available rooms in column B1.
Step 2: Import your room data
Next, you will need to import the room data for your property for the period you are interested in.
You may have this data in another Excel spreadsheet, accounting software, OTA data export, a paper diary, etc. How and where you store this is up to you.
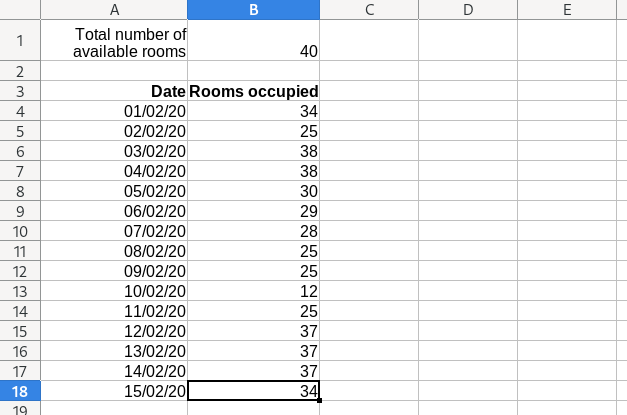
Ideally, we need to have the number of occupied rooms for each date in the period.
In our example, we have typed in the number of rooms occupied for each date in the last 15 days.
Step 3: Calculate the occupancy rate for each date
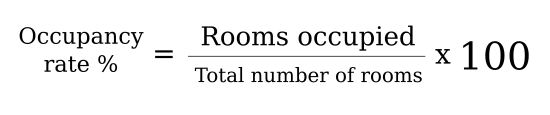
The formula to calculate the occupancy rate is simple:
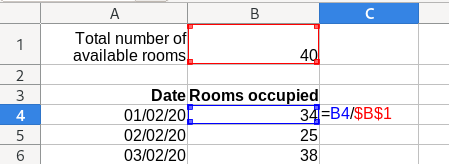
To express this in excel we can divide the total number of available rooms in B1, against each of the days in the spreadsheet.
For example, to calculate the first day’s occupancy rate we can do =B4/$B$1:
N.B. We type $B$4 instead of just B4 because we want to keep the second cell reference in the function static. This will be helpful when we use auto fill in Step 4.
.. and press the Return key on the keyboard
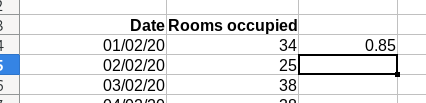
Excel will automatically calculate the occupancy rate for you in the cell.
Step 4: Auto fill the remaining cells
The remaining columns can be filled automatically.
Simply select the first column together with all of the empty columns below it:
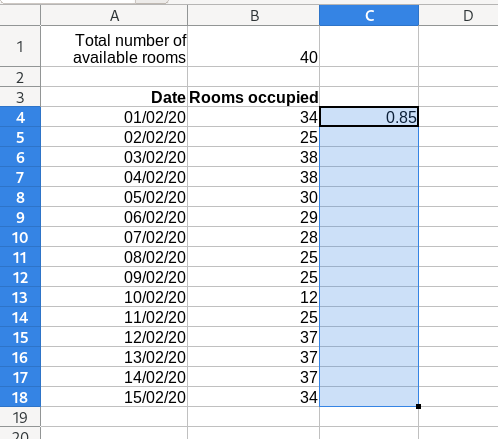
.. and press Ctrl+D on your keyboard
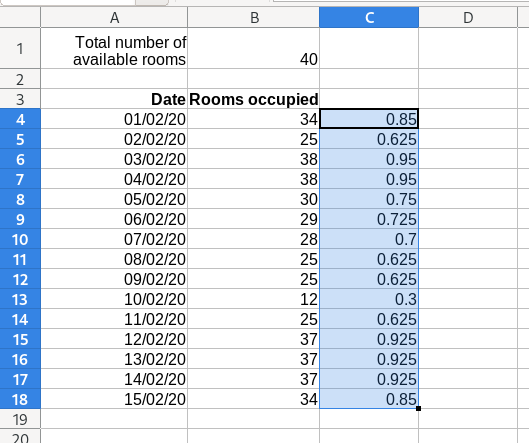
You now have the occupancy rate for every date automatically calculated as a fraction.
You can convert the fractions to percentages by selecting the cells and pressing Ctrl+Shift+% on your keyboard.
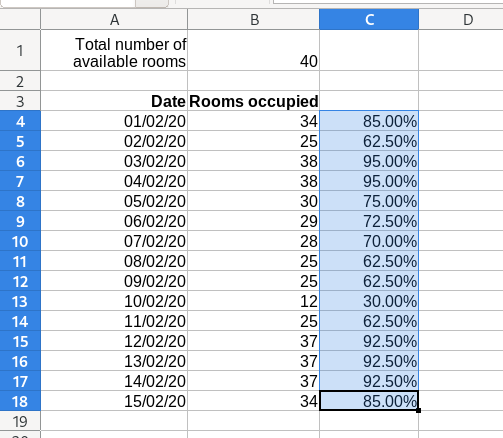
Step 5: Calculating the average occupancy rate for the period
If you want to calculate the average occupancy rate for the entire period, the AVERAGE function comes in handy.
The easiest way to use it is with the range operator.
Syntax: =AVERAGE(START:END)
In our example, we’ll use =AVERAGE(C4:C18):
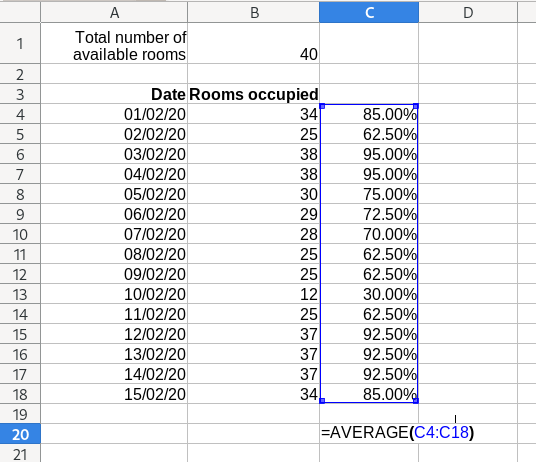
In our example, the occupancy rate for the period is 75%.
You can download our free template used in this demo.
In this demo we only used 15 days worth of data. Keep in mind that Excel can accept arbitrary amounts of data and extending our template should be trivial. Simply repeat Step 4 and Step 5 for as long as required.
Final thoughts
Microsoft Excel is insanely powerful and this post only scratches the surface of what you can do with it when it comes to calculating your hotel’s KPIs.
I’d recommend playing around with the formulas above and seeing what you can come up with.
You can also download more market data for your industry and your competition via the Hotel Price Reporter dashboard.
If you have any creative uses for Microsoft Excel of your own, please let us know in the comments. We’d love to hear them!